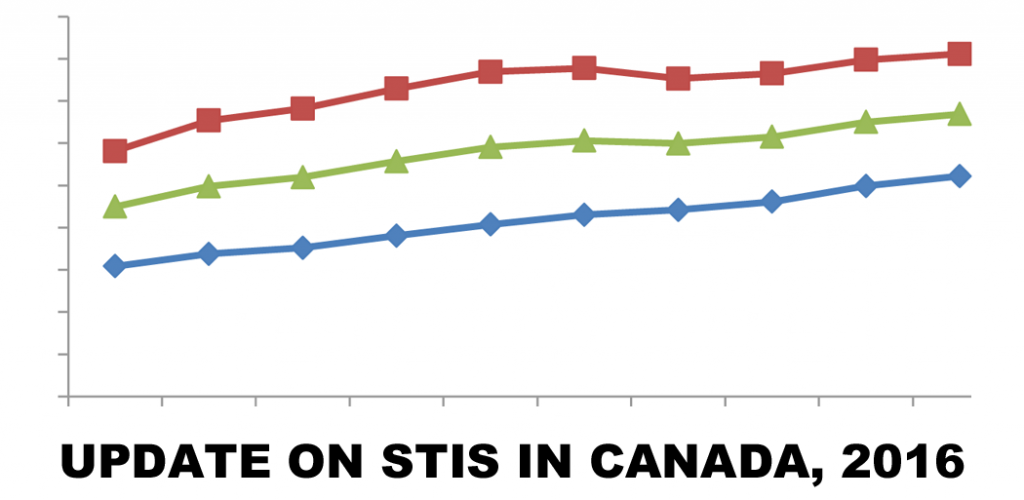
The recently released Update on Sexually Transmitted Infection in Canada, 2016 is a report from the Public Health Agency of Canada that provides info on trends and rates of chlamydia, gonorrhea, and syphilis over 2007-2016. The report is pretty big, and you can read the entire thing online on the Government of Canada’s website (Link), so we’ve pulled out some of the data as it relates to teens.
| ****NOTES**** |
|
Between 2007 and 2016, the number of reported cases and rates of chlamydia steadily rose. Overall, the number of reported cases increased from 73,937 in 2007 to 121,244 in 2016, corresponding to an increase in rates of 49% during this period (from 224.8 to 334.3).
For male teens in that time period:
| Year | under 15 years old | 15-19 years old |
| 2007 | 1.9 | 320.4 |
| 2008 | 2.4 | 366.0 |
| 2009 | 2.5 | 401.8 |
| 2010 | 2.4 | 422.1 |
| 2011 | 2.2 | 446.4 |
| 2012 | 2.4 | 464.5 |
| 2013 | 2.3 | 452.3 |
| 2014 | 1.4 | 458.8 |
| 2015 | 1.9 | 504.4 |
| 2016 | 1.9 | 527.6 |
By the end of 2016, the male age group with the highest rate was 20-24 year olds (1226), followed by 25-29 year olds (865.4).
For female teens in that time period:
| Year | under 15 years old | 15-19 years old |
| 2007 | 1.9 | 320.4 |
| 2008 | 2.4 | 366.0 |
| 2009 | 2.5 | 401.8 |
| 2010 | 2.4 | 422.1 |
| 2011 | 2.2 | 446.4 |
| 2012 | 2.4 | 464.5 |
| 2013 | 2.3 | 452.3 |
| 2014 | 1.4 | 458.8 |
| 2015 | 1.9 | 504.4 |
| 2016 | 1.9 | 527.6 |
By the end of 2016, the female age group with the highest rate was 20-24 year olds (2314.3), followed by 15-19 year olds (527.6).
Between 2007 and 2016, the number of reported cases and rates of gonorrhea steadily rose. Overall, the number of reported cases increased to 23,708 cases in 2016, almost double the 11,874 cases reported in 2007; this corresponds to an 81% increase in rates, from 36.1 to 65.4
For male teens in that time period:
| Year | under 15 years old | 15-19 years old |
| 2007 | 0.4 | 72.2 |
| 2008 | 0.7 | 71.6 |
| 2009 | 0.4 | 61.9 |
| 2010 | 0.8 | 60.9 |
| 2011 | 0.7 | 62.0 |
| 2012 | 0.6 | 62.5 |
| 2013 | 0.6 | 67.4 |
| 2014 | 0.3 | 70.5 |
| 2015 | 0.5 | 75.1 |
| 2016 | 0.4 | 83.9 |
By the end of 2016, the male age group with the highest rate was 25-29 year olds (269.6), followed by 20-24 year olds (246.6).
For female teens in that time period:
| Year | under 15 years old | 15-19 years old |
| 2007 | 3.5 | 150.8 |
| 2008 | 3.2 | 166.6 |
| 2009 | 3.0 | 146.2 |
| 2010 | 3.0 | 143.7 |
| 2011 | 2.5 | 140.8 |
| 2012 | 2.8 | 150.5 |
| 2013 | 3.7 | 151.1 |
| 2014 | 2.8 | 135.0 |
| 2015 | 3.0 | 153.7 |
| 2016 | 3.1 | 171.6 |
By the end of 2016, the female age group with the highest rate was 20-24 year olds (207.5), followed by 15-19 year olds (171.6).
Between 2007 and 2016, syphilis cases increased consistently with a particularly large increase from 2014 to 2015 (33% increase from 2,397 to 3,186 cases). Overall, the number of infectious syphilis cases more than tripled between 2007 and 2016 (from 1,250 reported cases in 2007 to 3,829 cases in 2016), corresponding to a 178% increase in rates from 3.8 to 10.6 per 100,000 population.
For male teens in that time period:
| Year | under 15 years old | 15-19 years old |
| 2007 | 0.03 | 1.23 |
| 2008 | 0.00 | 1.22 |
| 2009 | 0.00 | 3.39 |
| 2010 | 0.00 | 3.91 |
| 2011 | 0.00 | 4.45 |
| 2012 | 0.00 | 625.0 |
| 2013 | 0.00 | 3.93 |
| 2014 | 0.00 | 4.09 |
| 2015 | 0.03 | 5.29 |
| 2016 | 0.00 | 5.74 |
By the end of 2016, the male age group with the highest rate was 25-29 year olds (40.55), followed by 30-39 year olds (38.52).
For female teens in that time period:
| Year | under 15 years old | 15-19 years old |
| 2007 | 0.07 | 1.38 |
| 2008 | 0.04 | 2.09 |
| 2009 | 0.00 | 0.91 |
| 2010 | 0.00 | 1.46 |
| 2011 | 0.00 | 1.65 |
| 2012 | 0.00 | 1.49 |
| 2013 | 0.04 | 1.98 |
| 2014 | 0.04 | 1.83 |
| 2015 | 0.00 | 1.67 |
| 2016 | 0.07 | 3.49 |
By the end of 2016, the female age group with the highest rate was 20-24 year olds (5.99), followed by 25-29 year olds (5.44).
Regardless of the reasons for the increase in STI rates (improved screening/testing techniques, changes in behaviours and social norms around STIs and getting tested, etc.), it’s still important that people take steps to inform and protect themselves. So remember:
If you have questions about this topic, feel free to contact one of our peer educators. [Link]
Last Updated: April 2020
This article talks about Seasonal Affective Disorder, a form of depression that usually affects people in colder, darker months of the year.

In Part 2 of our Virtual Sex series, we’re going to go over a bit more of the Hows of virtual sex, including some tips and ideas for making it as sexy, safe, and fun as possible!
Caring for yourself during pregnancy or immediately after can be especially tough as a teen, this post shares some tips to manage your nutrition and includes some tasty, easy-to-make recipes!